scope basics I : Plotting a variable
this tutorial show how to set-up a real-time, continuous plot with periodic sampling of variable(s) with the scope tool.
- Let's presume that a successful comlink with the device was already established (the device is connected, connection options were set, the driver was installed, etc.)
- Let's presume that we are manipulating with just a single device.
- Let's presume that you know what variables are subjected to your interest.
For more information, check the scope manual page.
A good practice is to start the scope tool first (before setting up the on-board sampling service). That way, the scope will adjust itself according to the captured plot setup, (legend, scale, units, descriptions ...). The plot setup is streamed out from the device only when you are assigning a new variable to sample through plot.
Using the emGUI
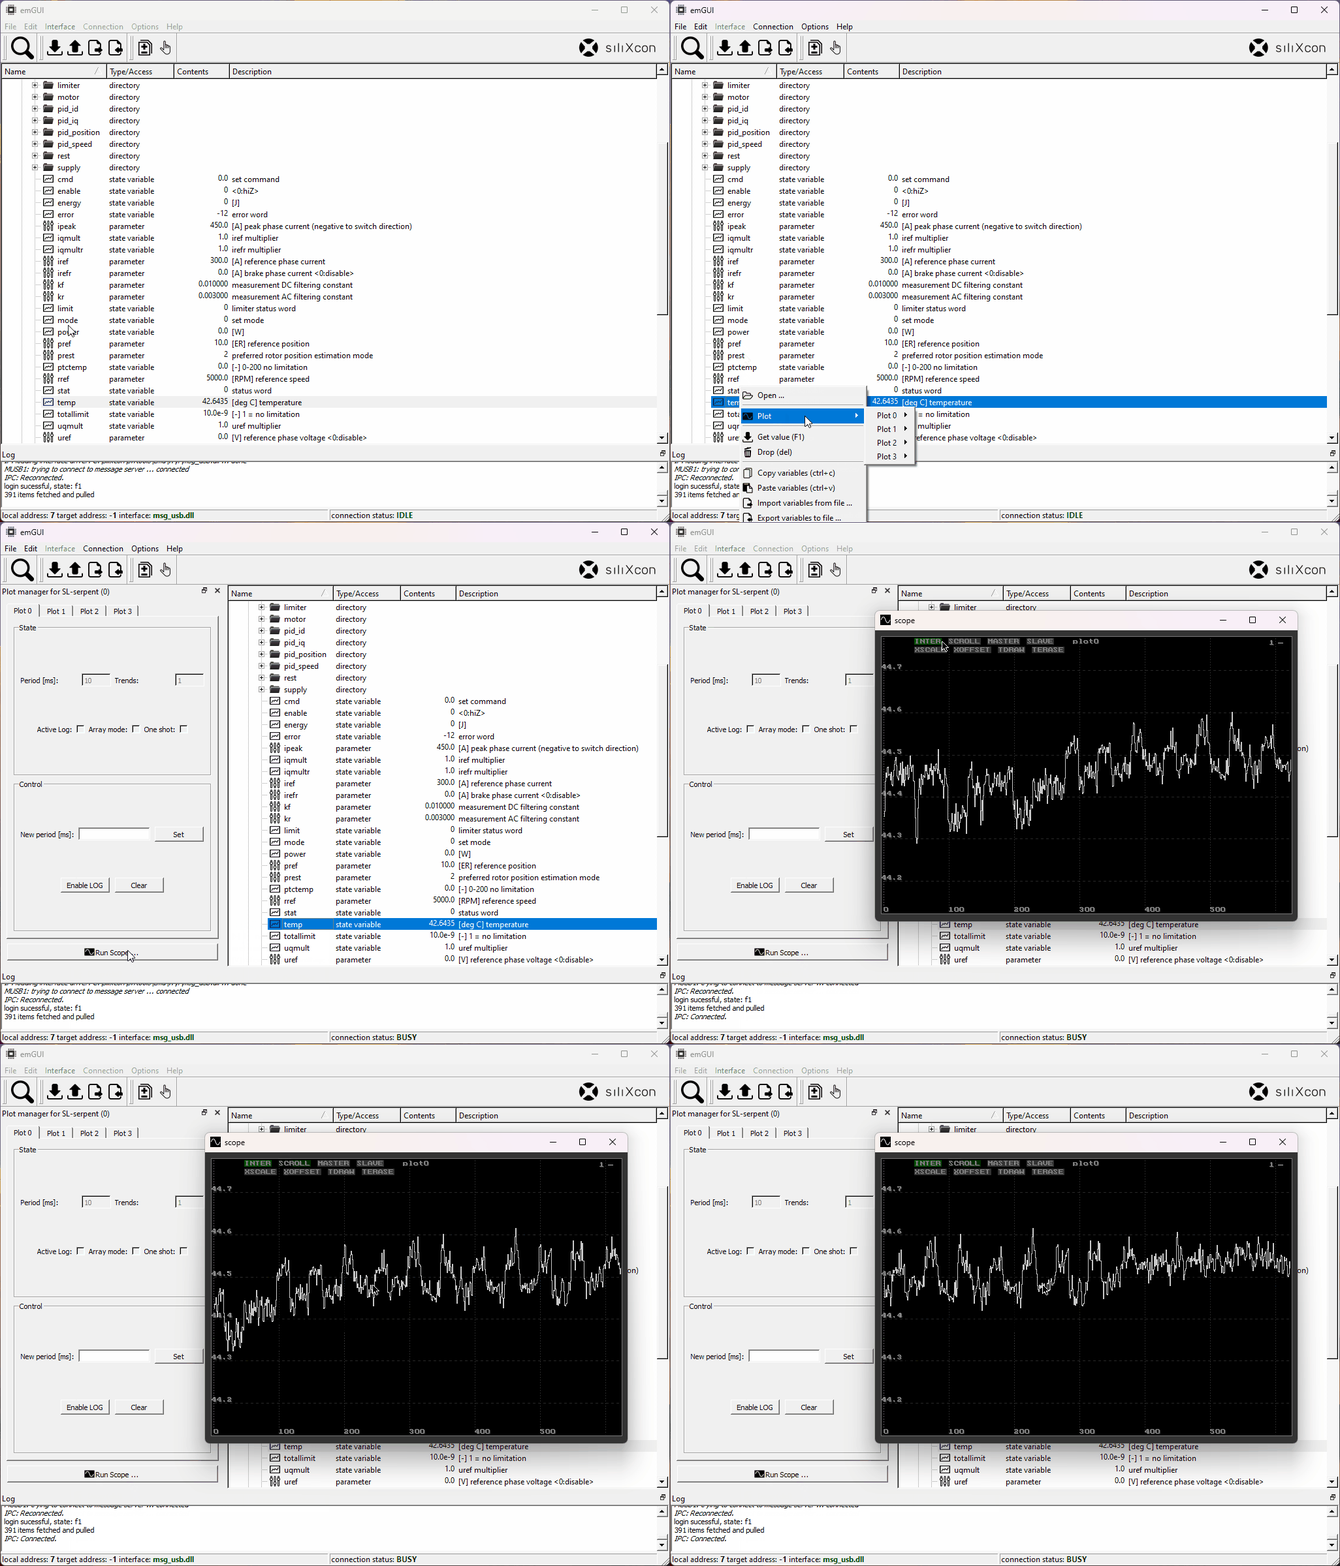
- Open scope to start capturing.
- Open emGUI and discover the device.
- Set up the periodic sampling: Right-click on your variable and select
Plot->Plot 0->Normal (periodic)option. The Plot manager window will pop up for consecutive control. There can be up to 8 scalar values per single plot frame and up to 4 plots per single scope window. - Bring the scope window forward and click into your plot frame to give it focus. Press
Enterto auto-scale your plot. Enable theINTERandSCROLLoptions if you wish vertical interpolation and left-to-right sample ordering mode. Let's keep all other options unchecked for this example. - You should see the captured samples rolling in a graph. Using the scroll wheel and drag and drop, you can navigate and zoom in/out in the graph.
Repeat that for other variables, if needed.
-
The default (Normal option) initiates periodic sampling. You can adjust the period afterward. The default period is 10 ms.
-
If you select One shot option, the variable sampling will happen only once. Only a single sample of the variable will be sent out, and captured by the scope.
-
You may also select to plot as array. In that case, instead of periodic sampling, the array index will be linked to the plot frame's buffer index (through triggering). For more info, read the YOS
plotcommand manual or check the Plotting an array tutorial.

Using the term
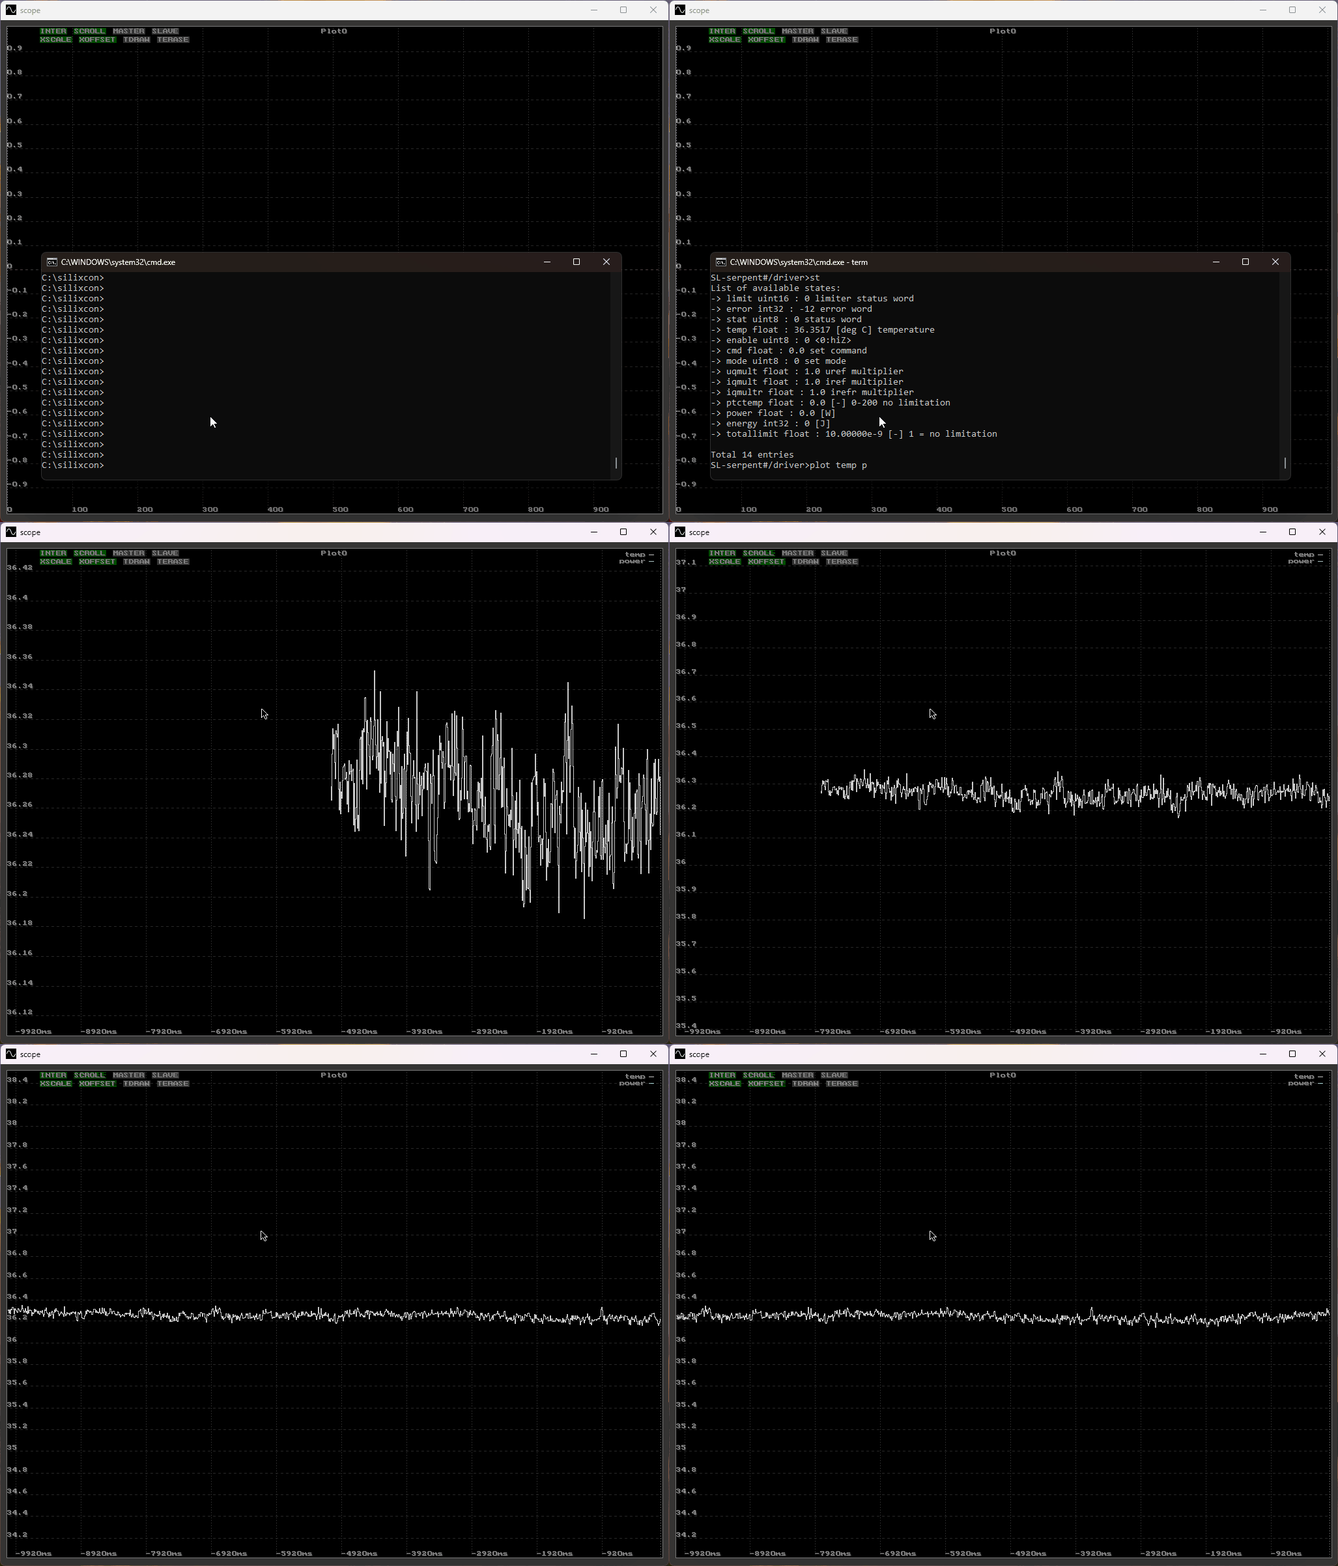
- Open scope to start capturing.
- Open term to get access to the device CLI.
- Login to the device (if needed).
- Set up the periodic sampling: Type
plot <variable_name>. Remarks:- You can specify multiple variables to plot at once -
plot temp power energy. Either use variables at your current directory or specify a full path to the variable -plot /driver/temp - If you want to switch plots, type
plotwithout arguments. There can be up to 8 scalar values per single plot frame and up to 4 plots per single scope window. plotcommand has many refining options. Please refer to the YOS manual for the command docs.
- You can specify multiple variables to plot at once -
- Bring the scope window to the top and click into your plot frame to give it focus. Press
Enterto auto-scale your plot. Enable theINTERandSCROLLoptions if you wish vertical interpolation and left-to-right sample ordering mode. Let's keep all other options unchecked for this example. - You should see the captured samples rolling in a graph. Using the scroll wheel and drag and drop. you can navigate and zoom in/out in the graph.
Repeat that for other variables, if needed.
If you choose periodic sampling of an array variable, the individual elements will be mapped to the separate trends by default. Alternatively, you may use YOS indexing to plot only a subset of the array members. For example:
plot <array_name>.0to plot the first memberplot <array_name>.1.2to plot the second two members
