scope basics II : recording, playing, saving and loading
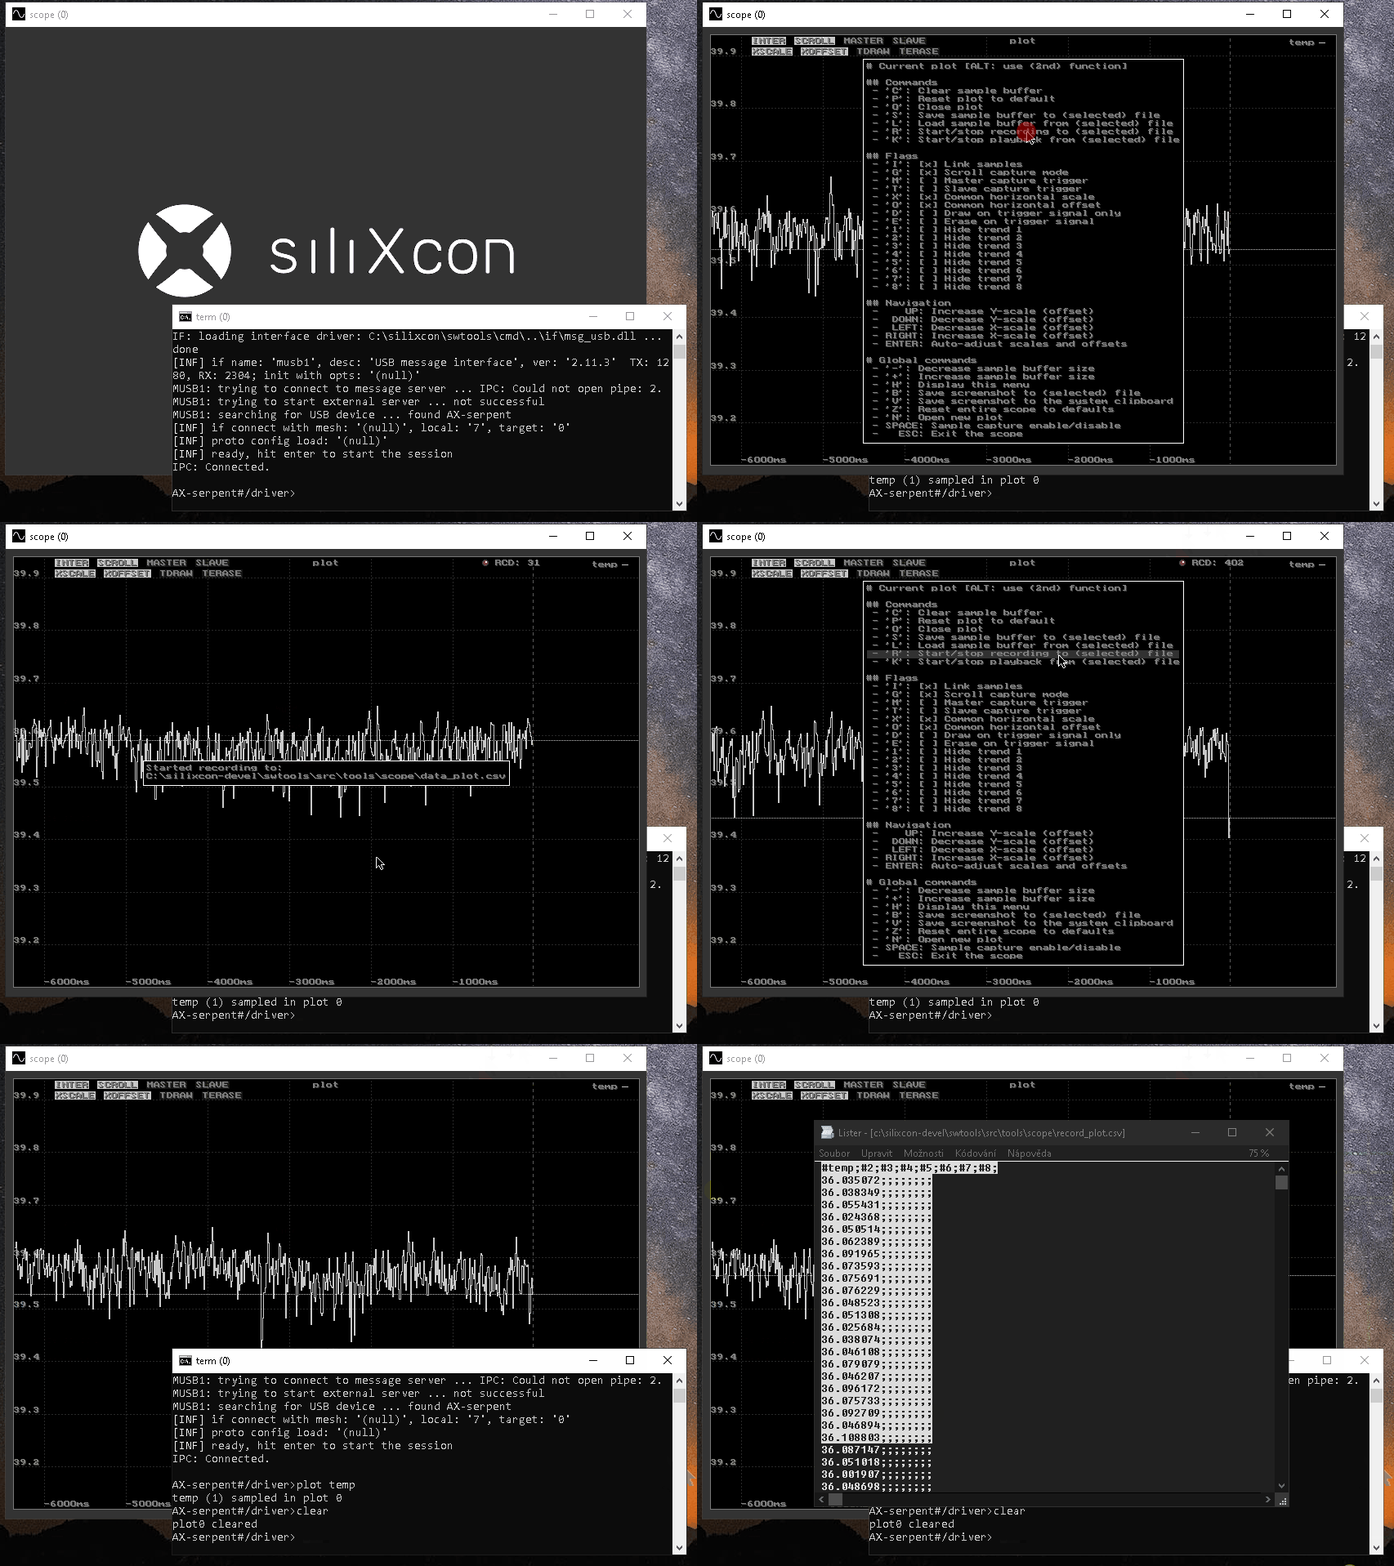
this tutorial shows you how to set up continuous sample data recording from the device using the scope tool. It also briefly mentions the other file operations.
- Let's presume that you know how to sample the variables of your interest.
- Recording and playback is a continuous process that works in real-time with incoming samples and can be turned on/off by the user.
- Saving and loading is a single-shot operation that works with the entire sample buffer.
- For more information, check the scope manual page.
Record the captured samples in a CSV file
- Plot your continuously changing variables first.
- Bring the scope window to the top and click into your plot frame to give it focus.
- Right-click in the scope window and select
Start/Stop real-time recording to (selected) file, or use the keyboard shortcut:R(if you also want to choose the file, holdCtrlsimultaneously). Specify the file location and name, and clickSave. - Now, all the incoming samples of a chosen plot frame are continuously recorded in the file. At the top, you will see the recording status.
- If you press
Spaceit will pause/unpause capturing of all new samples, as well as the recording. - If you press
Ragain, the recording will stop. - If you press
Ryet again, it will overwrite the file and start recording again.
You may also initiate playback. Playback is a complementary function to record. Once initiated, it periodically checks the input file for changes and loads its entire content as if the samples were captured from the device.

Save the actual sample buffer to a CSV file
- Bring your plot frame to the foreground by clicking on it. Make sure you have some data displayed in that frame.
- Right-click in the scope window and select
Save current plot data to (selected) file, or use the keyboard shortcut:S(if you also want to choose the file, holdCtrlsimultaneously). Specify the file location and name, and clickSave. - Now all data from the scope are exported to the file.
You may load the data from the file back to the scope again using Load current plot data from (selected) file or using the keyboard shortcut: L (if you also want to choose the file, hold Ctrl simultaneously).
The CSV file format
Each line represents a single sample. The first column is the first value of the sample, the second column is the second value and so on. The first line usually holds the trend Headers.
#temp;#2;#3;#4;#5;#6;#7;#8;
36.035072;;;;;;;;
36.038349;;;;;;;;
36.055431;;;;;;;;
36.024368;;;;;;;;
36.050514;;;;;;;;
...
...