emGUI
is a stand-alone windowing environment for application-level manipulation with siliXcon devices. It is a GUI counterpart to the yosctl tool.
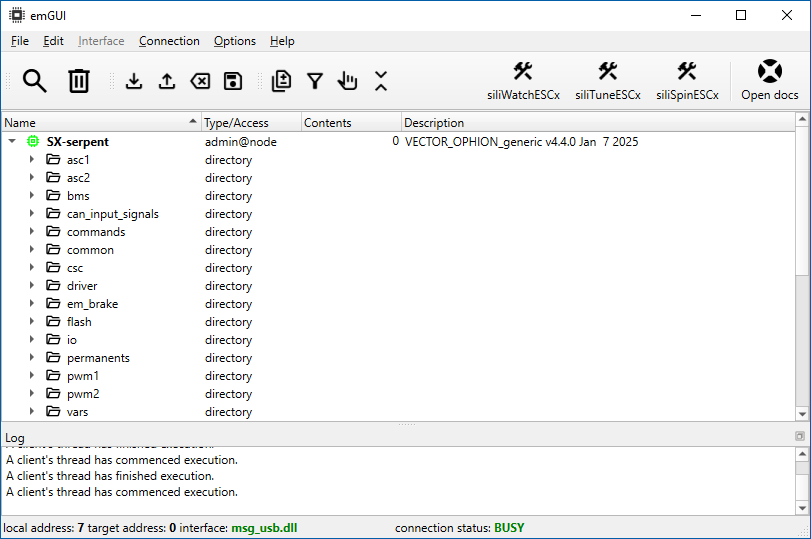
Functional description
emGUI is built around the tree of managed items - the data model of the device (maintained by its operating system). Using the siliXcon service protocol, emGUI provides a mechanism of dynamically synchronizing the data model as well as content with the device or multiple devices. emGUI holds an internal image of the model together with values and it provides a user interface for its comprehensive reading/writing/importing/exporting/executing.
For a quick start, you may rather want to check our basic emGUI tutorial.
CLI options
emGUI accepts standard connection options. The non-option arguments are treated as file names with SXapi/Python plugin code.
If one or more scripts are specified, the emGUI window starts in quiet (hidden) mode. If only a single script is specified, it is run in exclusive mode.
Without any scripts, the quiet mode can be still forced by specifying the -q option. In this case, emGUI runs as a daemon and is auto-terminated
within 30 seconds (unless a SXapi/Server client establishes a connection).
Main menu
The main menu features a few topics of global program commands/configuration.
If a sub-menu item name ends with dots (...), it suggests that a follow-up dialog will be invoked.
File
The generic (mostly) file-related operations can be triggered there. Namely:
- Open plugin in either exclusive or non-exclusive mode. Exclusive mode dedicates the global Python interpreter to the single plugin, whereas non-exclusive mode, using sub-interpreters, allows one to run multiple plugins at the same time. Plugins can be used to preset a workspace.
- Importing/exporting variables to/from a file (for all discovered nodes). This will pop up a dialog that allows directory selection, import/export options, etc. Two shortcut icons are offered in a dock widget for the same operations.
- Search for nodes trigger, doesn't discard any tree, only append new. This icon is also available in the toolbar.
- Discard tree will remove all nodes from the tree. This icon is also available in the toolbar.
- Generate diagnostic report will create a text file with the current state of the emGUI (tree, values, etc.), log, pmlog and internal script. The file will be saved in the current working directory.
- Exit the program.
Edit
The tree editing commands and viewing options can be tweaked from here. Namely:
- Copy & Paste - You can export/import all/selected tree (subtree) entries and their values to/from a clipboard (Standard
Ctrl+CandCtrl+Vshortcuts apply). - Show changes only - Turning on will engage the diff filter (the tree only show variables whose values have been changed from their defaults or are marked as inconsistent). This icon is also available in the toolbar.
- Show filtered only - Turning on will engage the name filter. Only matching items will be displayed. If the directory match is found, all entries within that directory will be displayed. This icon is also available in the toolbar.
- Process selected/filtered only - Enables working with multiple entries (also ones that pass the filter). This can also be engaged by holding the
Ctrlkey while clicking on an entry. This icon is also available in the toolbar. - Collapse all - Collapse all subtrees. This icon is also available in the toolbar.
When Process selected/filtered only is enabled, certain operations are offered in group mode. For exp. exporting/importing, getting/setting or plotting can be triggered on multiple entries at once.
Interface
The communication interface can be selected and configured from here. This menu can only be accessed when the connection status is Disconnected. Namely:
-
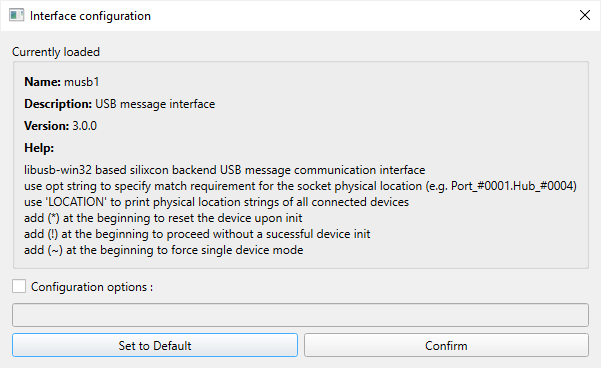
Configuration will open a dialog that will display information about the currently loaded interface driver and a textbox for editing its option string.
-
Unload will unload the currently loaded interface driver.
-
(up to nth) These checkable items hold the names of the discovered interface drivers. You may load the one you want.
-
Custom loads a custom interface driver by specifying it's path.
Connection
The status of the connection, as well as link addressing, can be manipulated from here. Namely:
-
Connect and disconnect will initialize and deinitialize the link. The Search operation auto-initializes if the interface driver is loaded but not initialized.
-
Addressing will open up a link-layer addressing options dialog.
-
Protocols shows a submenu that allows the user to select alternate protocol configuration, if available.
Options
Various, otherwise unclassified global options can be adjusted here. Namely:
-
Authentication will show a pop-up dialog where the user can adjust the authentication token:
-
Fixed point base, through the submenu, allows to set the global radix for fixed-point values stringification. Note that string parsing is not affected (base is selected by the prefix e.g.
0x20,0b101, etc.) -
Floating point precision, through the submenu, allows to set of several options for global floating-point value stringification. Note that string parsing is not affected.
-
Search options, through the submenu, allow toggling several flags for the Search operation.
Help
- Website is a link to the siliXcon website.
- Documentation is a link to the website containing this documentation. The siliXcon logo on the right of the toolbar serves the same function.
- About shows a pop-up dialog with the tool description and build version.
Adjustments under Interface, Addressing, Protocols and Authentication are for advanced usage only. The content presented here is already defined in connection options and is passed to the emGUI during start-up (either from the local environment or from the global connection option set).
For basic usage, use LaunchPad to set your connection options.
Toolbar
The toolbar offers a few icon buttons as shortcuts to the typically used operations On the left side, some of the File and Edit actions, such as Search, Discard, etc. Additionally, a few combined actions are offered:
- Global value push / pull
works for all discovered nodes. Two acticons are offered (
F1andF2shortcuts apply) with the following icons:
- Global parameter load / save works for all discovered nodes. Not that before the save, a consistency check is performed. After loading, a value pull is performed. Two acticons are offered, with the following icons:
Plugin and doc shortcuts
Apart from the link to this documentation portal under the siliXcon logo, the SXapi plugins found in '/plugins' directory are triggerable on the right side under these icons:
Status bar
The status bar shows a quick overview of:
- the selected connection options. The color of the interface driver name indicates its loading status.
- the status of the connection. The color of the text value indicates normal and erroneous states.
- filter input is the string you can type within the tree. If a filter is engaged, only matching items will be displayed.
Log
is a scrolling, read-only, detachable text frame displaying a textual log of significant events; primarily used for debugging. SXapi output is also directed there.
Main tree
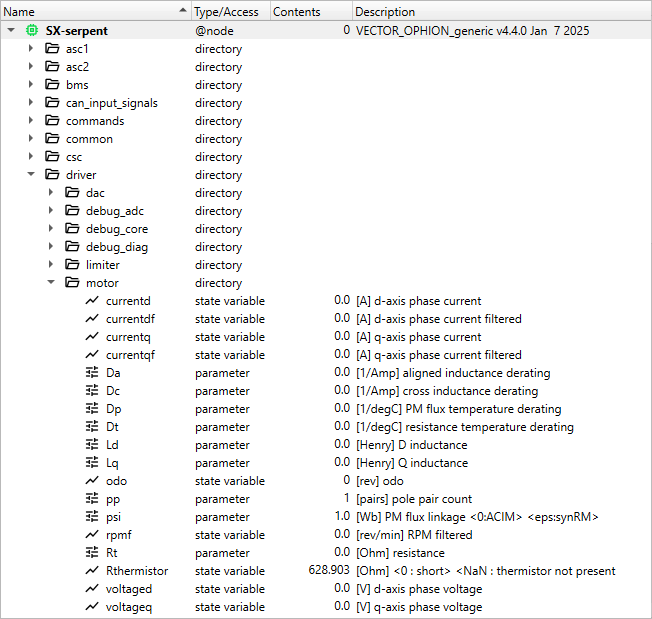
The main tree is a depiction of the discovered device(s) and their data model(s). Tree nodes can be expanded or collapsed on demand. There are four columns in the tree widgets with distinct content:
- Name A textual representation of the entry identification.
- Type/access The entry type. In case of restricted access, the type will be appended with a string defining rights for the logged user. Logged user is prepended before the node's name.
- Contents A (truncated) evaluation of the data held within the entry. Note that a distinct dialog is offered for each type to enable full display.
- Description A (truncated) evaluation of the entry's textual description.
Name filter
By simple character typing inside of the tree, a name filter will become engaged. The filter string is displayed in the status bar. Only matching entries will stay in the tree, all others will become hidden.
Tree entries
The tree entries represent entities in the network of devices and their data models. The type of entry may be one of:
- node (device)
- folder
- variable
- state variable
- parameter
- permanent variable
- dynamic variable
- command
- arbitrary data
- i/o device
Only the most used entry types will be discussed here. Each tree entry type has a distinctive context menu, which may be accessed by right-clicking the entry. Double-clicking an entry will open its default view/edit dialog (except for Folder entries).
Node
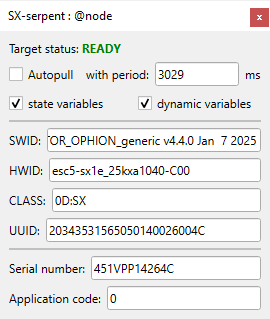
The node is the root entry of the tree and is associated with the communication context with the device. The node's dialog displays the main device identifiers. Also, it allows you to configure auto-pull values for the entire device.
The Target status field indicates the status of the communication session with the device. The session is safely restored each time the Search operation is initiated, but dialogs and plugins will lose their context. You may manage the session in the Session submenu and attempt to restore it once lost, without losing your work. The target status is also indicated with the icon (and color) of the node entry inside the tree.
The possible values are:
- READY : up and running
- STALL : waiting for an asynchronous event
- INCONSISTENT : the context between device and emGUI may have diverged
- LOST : communication was lost
- UNKNOWN : communication has not been established
The context menu of the node, apart from opening the node's dialog, features a set of actions related to the entire device. First of all, there is a section of predefined command managers.
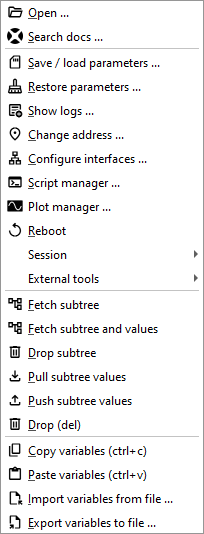
- Save / load parameters dialog (on-board saving and loading of parameter values)
- Restore parameters dialog (factory settings by restoring all parameters to their default values)
- Show logs (for reading the on-board logs)
- Change address (for changing the device's address)
- Configure interfaces (for overriding the device's interface configuration)
- Plot manager (for managing the on-board plot service)
- Script manager (for managing the on-board persistent script)
- Reboot command trigger
- Session management (where you can manage the existing data emGUI <-> device synchronization session)
- External tools triggering (scope, term, bl_srm)
The next two sections are identical to the ones offered by the Folder's context menu (see below).
Folder
The folder is a branching entry that typically corresponds to a folder inside the device's internal data model. The context menu of a folder, apart from opening the folder's dialog, offers mainly (re)synchronizing model and data of the descending tree:
- Fetch subtree will reload the data model from the device
- Fetch subtree and values will reload the model with values
- Drop subtree will cause forgetting the descending items
del - Pull subtree values will download the variable's values
F1 - Push subtree values will upload the variable's values
F2 - Drop will forget this item
The last section offers a few editing actions (clipboard and file import/export) for the descending tree:
- Copy variables the through-clipboard export trigger
Ctrl+C - Paste variables the through-clipboard import triggered
Ctrl+V - Import variables from file the through-file import trigger
- Export variables to file the through-file export triggered
The folder's dialog shows the optional description of the folder. Also, it allows you to configure auto-pull values for the descending tree.
Variable
The variable is a data entry with a well-known type and size. The variable's data (value) and metadata (description) are available for tweaking. Also, emGUI attempts to evaluate the variable's value in the Content column for in-line viewing and editing. The classes of variables are inherited from the YOS system. Each type has a distinctive viewing/editing dialog (refer tutorials for examples):
- Parameter (read-write with rich presets), only the user can change
- Dynamic variable (read-write), the model can change in run-time
- State variable (read-only), only process can change
- Permanent variable (read-only), non-volatile memory
In all the variable dialogs, as well as in the content column, a special status of the value is indicated by a special color and style of its string:
- Bold : value has been changed from it's default
- Blue : value has not been synced with the device (marked inconsistent)
- Yellow : value has been imported from file/clipboard
- : value has just been read from the device
- : value has just been written to the device
In all the variable viewing dialogs, the bad result of the communication with the device regarding value exchange is indicated by a background color of the value's string:
- orange - an arbitration miss. The value exchange has not been successful.
- red - a critical error (no response from device, etc).
As mentioned above, the emGUI holds an internal mirror of the device's data model and also the values of the variables. The values are not automatically synchronized with the device. To get and set the value, you need to do a get/set action or push/pull action for the entire device/tree/sub-tree. You can set up automated pull for a part of the tree.
The context menu of a variable, apart from opening the variable's dialog, offers mainly actions to synchronize (get and set) the value from/to the device. Also, there is a shortcut for assigning the variable to the on-board sampling service (plot):
- Plot will allow (through sub-menu) to assign the variable to the on-board sampling service (plot).
- Get value will download the value from the device.
- Set value will upload the value to the device.
- Drop will forget this item
The last section offers a few editing actions (clipboard and file import/export). See above.
Command
The command is an entry linked to an executable command inside the device. A command can be executed on demand and a mechanism of passing input arguments, obtaining return value, as well as reading/writing input/output stream is provided.
There are two ways on how to exchange input and output with the commands:
- Arguments and result The dialog contains input string argument boxes and a single number result box. If up to four argument boxes are filled before execution, they will be passed on to the command. After execution, the return value is displayed in the result box.
- Standard input and output The dialog consists of standard input and output edit boxes. The input can be either filled before execution or, if the command awaits input, the standard input box will be highlighted.
Variable import/export
Variables and their values may be imported/exported on demand. This imports and exports the current state of the part of emGUI's content image, not the actual values in the device.
Choose what to export / where to import (within the emGUI):
- The entire tree. Use File or Edit menu. In case of more devices discovered, you will be prompted for each device separately.
- A sub-tree. You may only select a single device or a folder.
- A multi selection. Holding CTRL+selecting your entries (a selected folder will be crawled recursively).
You may check the process selected/filtered only if you want to only process the entries that are actually selected or passed through the filter.
Choose Where to export / import from (outside the app):
-
Local file. Use File->Export variables to file or File->Import variables from file for the entire tree or multi-selection. For sub-tree use the Context menu of the corresponding tree entry and select Export variables to file or Import variables from file. You will get a separate dialog for import and export, where you can specify the filename and related options:
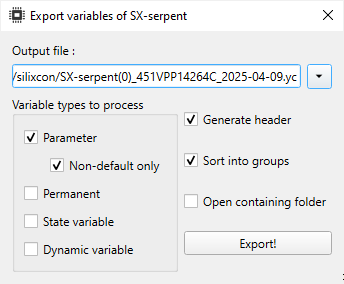
The example of the file content:
# emgui version: 2.11.3
# time generated: 2023-12-11, 17:07:07
#
# basename: 'AX-serpent'
# hwid: 'esc5-ax1d_05kxa0810-800'
# swid: 'BLDC_OPHION_generic v4.2.0-punk Jul 20 2023'
# s/n: '895FMP114D4D'
# uuid: '20383935464D5011004D004D'
# class: '0E:AX'

# type : 'parameter' (non-default value)
"/driver/iref" : "60.0"
"/driver/prest" : "1" -
System clipboard. Either navigate to the Edit in main menu, Copy or Paste in the context menu, or use
Ctrl+CCtrl+Vshortcuts. The example of the clipboard content:"/driver/supply/cap" : "0"
"/driver/supply/current" : "0.0"
"/driver/supply/currentf" : "0.0"
"/driver/supply/voltage" : "0.028445"
"/driver/energy" : "0"
"/driver/iqmult" : "1.0"
"/driver/irefr" : "0.0" -
Imported with drag and drop. Drag a file using the file system manager and drop it onto an item in the main tree. If you wish to import variables for the entire node, choose the root item.
- If the file contains a variable(s) that do not match with the user's selection in the tree, it will not be imported.
- When using the clipboard, all variable types will be exported and only writable ones will be imported.
Frontend dialogs
are dedicated to single-shooting certain typical commands or sets of commands inside the device.
On-board save and load
A prompt dialog that serves as a frontend over the save and load commands. Pressing Save or Load will execute these. Optionally, there is also the Backup storage option. Checking Pull parameter values will perform this action after completion.
On-board restore default parameter values
A prompt dialog that serves as a frontend over the restore commands. Pressing Restore will execute that. Checking Pull parameter values will do so after completion.
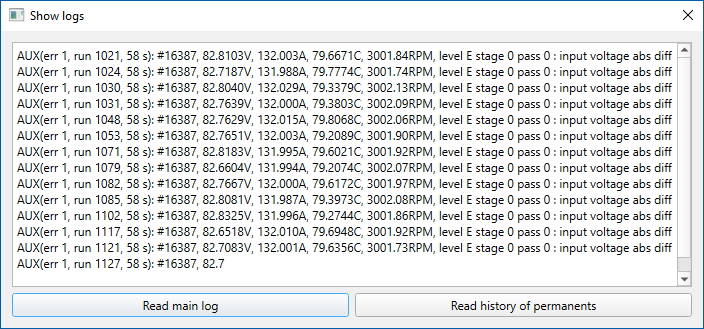
Read and show logs from the device
A prompt dialog that serves as a frontend over the log and pmlog command. Read main log button performs simple retrieval of the main log and Read history of permanents reads out the recorded history of the permanent variables.
Change device address
A prompt dialog that serves as a frontend over the setaddr command. It enables you to change the device's address to a specified value. You can continue using the device after changing the address, as the change only takes effect after a reboot or power cycle. At that point, you will lose the connection and must use 'search nodes' to reconnect, as 'reclaim' won't suffice because the device will be at the new address.
Override Interface and Protocol Configuration
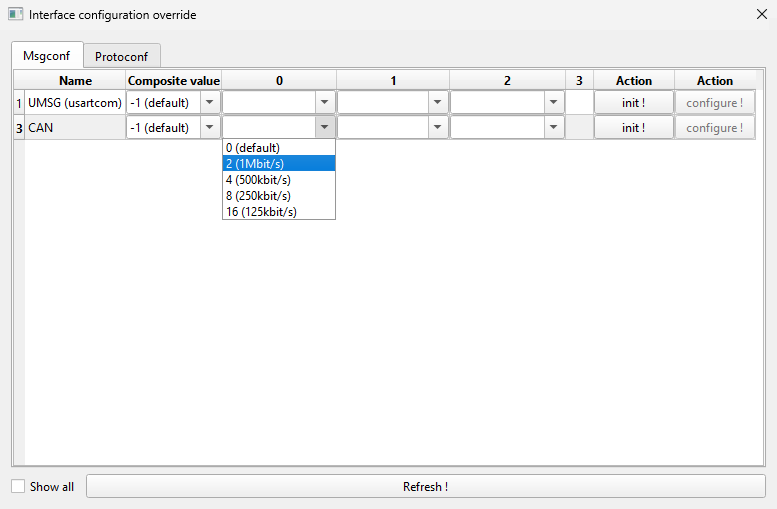
A user-friendly dialog serving as a frontend for the msginit, msgconf, and protoconf commands. This tool allows you to override onboard interface configurations with ease. For each interface, multiple presets are available via dropdown menus. The first column displays a composite 32-bit configuration value for each interface. Two action buttons are provided:
- init! Applies changes immediately for the current session by invoking
msginitwith your selected configuration. - configure! Saves your configuration permanently to the device's metadata via
msgconf.
Similar functionality is available for protocol configuration, enabling you to customize embedded stack protocols through the protoconf command. For guidance on appropriate configuration values, please contact siliXcon.
Managers
are actively linked to certain services/processes inside the device through a set of commands. Unlike front-end dialogs, managers are not modal. Therefore, you can keep using the rest of emGUI while keeping a manager window simultaneously.
Plot manager
is a simple dialog for active management of the plot (real-time data sampling) service inside the device. For each plot, the window shows its status. Similarly, it allows for clearing trends and setting the sampling periods.
Script manager
is a simple active management tool for the script (persistent script) command inside the device. It allows to issue start/stop, as well as read/install(write)/erase the script within it's dedicated, non-volatile memory.
It also periodically checks the script's status and displays it in a label.
The data entered in the edit box is loaded directly to the device. To import a script from a file, use the import button and navigate to the correct folder. The file will be preprocessed before loading More about preprocessing directives in term.